
The GEMS app
See the condition.
Understand the next step.
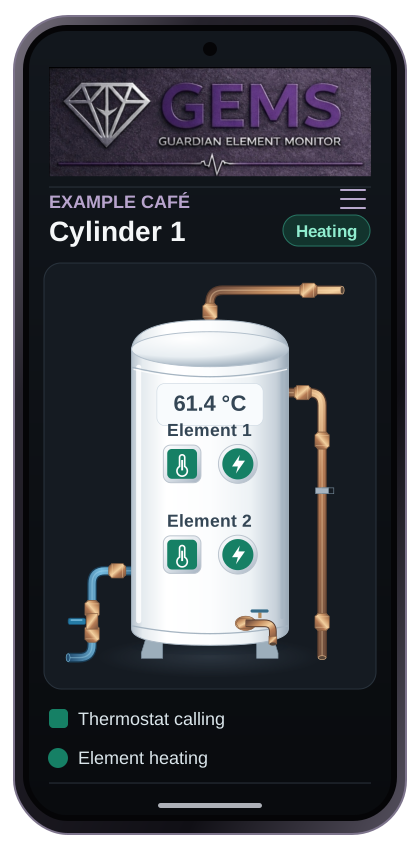
See temperature and individual elements together. Squares show the thermostat call; circles show each element’s measured load.
- Your assigned sites in one place
- Current readings and supporting history
- Clear indication when readings are unavailable
GEMS appSite conditions at a glance
The Grafana monitoring view
The readings behind the view.
Review temperature and electrical history to understand how the condition has changed and give your maintenance team useful context.
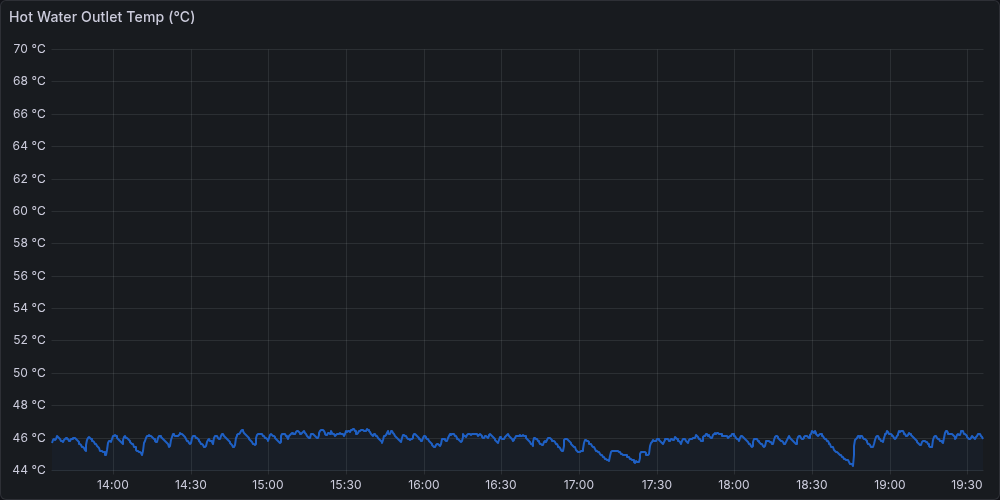
Water temperature history
Outlet temperature across the six-hour monitoring window.
- Outlet temperature · °C
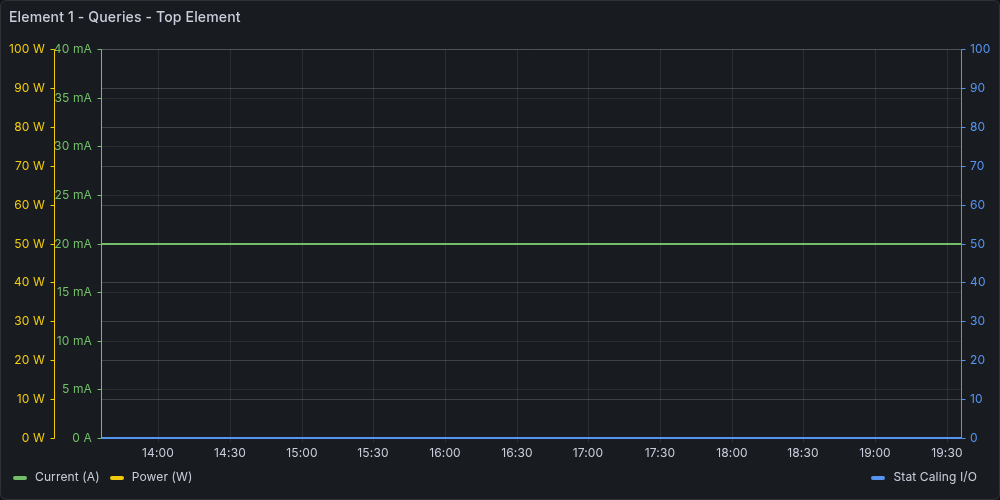
Top element electrical history
Review measured current and power alongside the thermostat call signal.
- Current · A
- Power · W
- Thermostat call · on/off
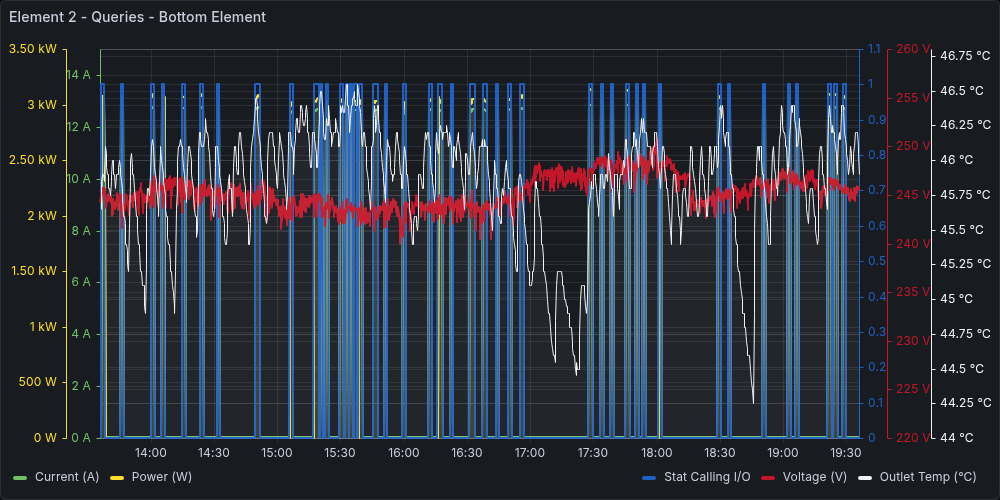
Bottom element electrical history
Compare the electrical measurements, thermostat call and outlet temperature over time.
- Current · A
- Power · W / kW
- Thermostat call · on/off
- Voltage · V
- Outlet temperature · °C
Understand the condition
See temperature and individual element measurements together.
Review the history
Use trends to put the latest reading in context.
Plan your response
Prepare a clearer starting point for maintenance.
Give your team a clearer site view.
Talk to E2M about GEMS for your site or estate.